


Analysis of the model for a 5.10 m flood
The
reference
for
a
5.10
m
flood
at
the
Mopti
gauge
is
the
1990
flood.
Landsat
images
are
available
for October 1, October 10 and November 27.
The
1990
flood
is
very
peculiar,
with
higher
flood
than
expected
for
a
flood
height
of
5.10
m
at
the
Mopti
gauge
in
Sofara
and
Ké
Macina
but
with
an
atypical
time
lag
between
the
Niger
and
Bani
floods
and
a
bimodal
flood
at
Sofara.
The
flood
at
Akka
is
significantly lower than expected with 5.10 m at Mopti.
According
to
J.P.
Lamagat's
model,
a
5.10
m
flood
at
Mopti
should
correspond
with
4.24
m
in
Ké
Macina,
while
4.41
m
were
actually
recorded,
a
level
corresponding
to
a
5.30
m
flood
height
at
Mopti.
Similarly
the
flood
height
at
Sofara
should
be
3.89
m
while
4.28
m
were
actually
recorded,
corresponding
to
a
flood
height
close
to
5.40
m
at
Mopti.
The
low
flood
height
at
Mopti
in
1990
is
explained
by
the
bimodal
flood
at
Sofara
and
by
the
very
unusual
flood
peak
offset
between
Sofara
and
Mopti
which
also
explains the abnormally low value in Akka.
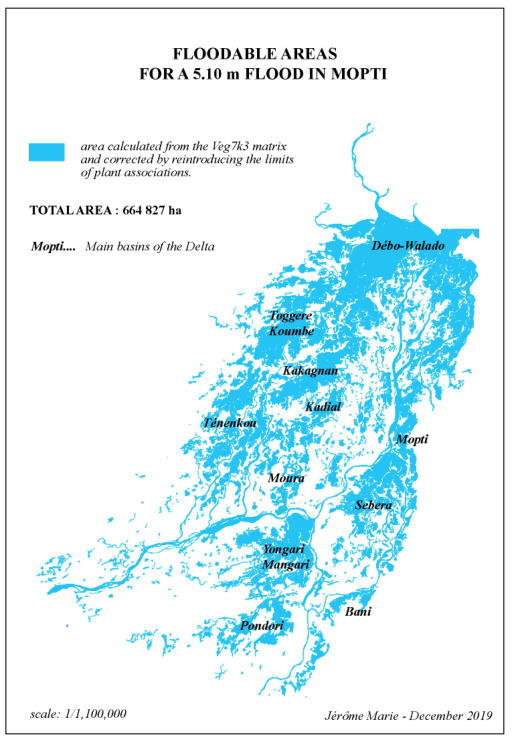
The
flooded
area
calculated
by
the
model
for
5.10
m
-
shape
(Niv_510)
-
extends
over
747,325
ha,
which
overestimates
the
area
actually
flooded
quite
significantly.
This
is
explained
in
particular
by
the
overflows
of
the
matrix
at
level
55,
which
precisely
correspond
to
the
5.10
m
flood
height.
After
integration
into
Veg7,
the
shape
file
Niv_510_Veg7
shows
a
flooded
area
reaching
664
827
ha,
the
value
retained
for
comparison
with
Landsat.
This
value
is
very
close
to
that
obtained
by
directly
taking
into
account
on
Veg7 only the vegetation associations whose flood depth is below -1.50 m (664 953 ha).
The
map
above
(left)
figures
the
flooded
areas
according
to
the
model
for
a
water
height
of
5.10
m
at
the
Mopti
gauge.
While
for
a
flood
of
5.97
m,
the
Delta
still
presented
a
continuous
body
of
flood
water,
for
one
of
5.10
m
the
body
is
fragmented,
suggesting
the
large
deep
basins
of
the
Delta
(see
page
49).
The
map
also
shows
areas
with
scanty
flooding,
in
particular
the
upper
Niger River downstream from Ké Macina as well as downstream along the Niger and Diaka separation, and also the southern Delta.
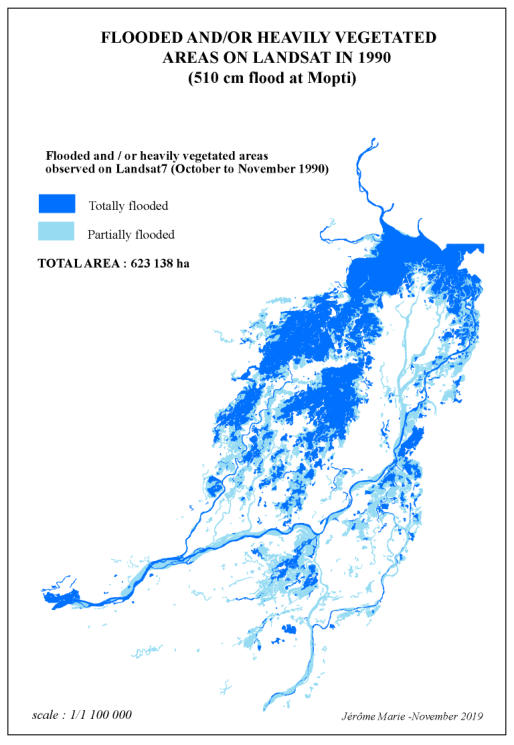
The
map
drawn
from
the
analysis
of
Landsat
images
shows
flooded/vegetated
areas
extending
over
623,138
ha,
rather
close
to
the
flooded
area
calculated
by
the
Niv_510
model
(664,827ha)
but
with
a
somewhat
different
distribution,
as
shown
in
the
synthesis
map
-
shape
(synthesis_510_1990)
-
which
groups
together
the
shape
files
(commun_1990_510,
inon_plus_1990
and
inon_
moins_1990)
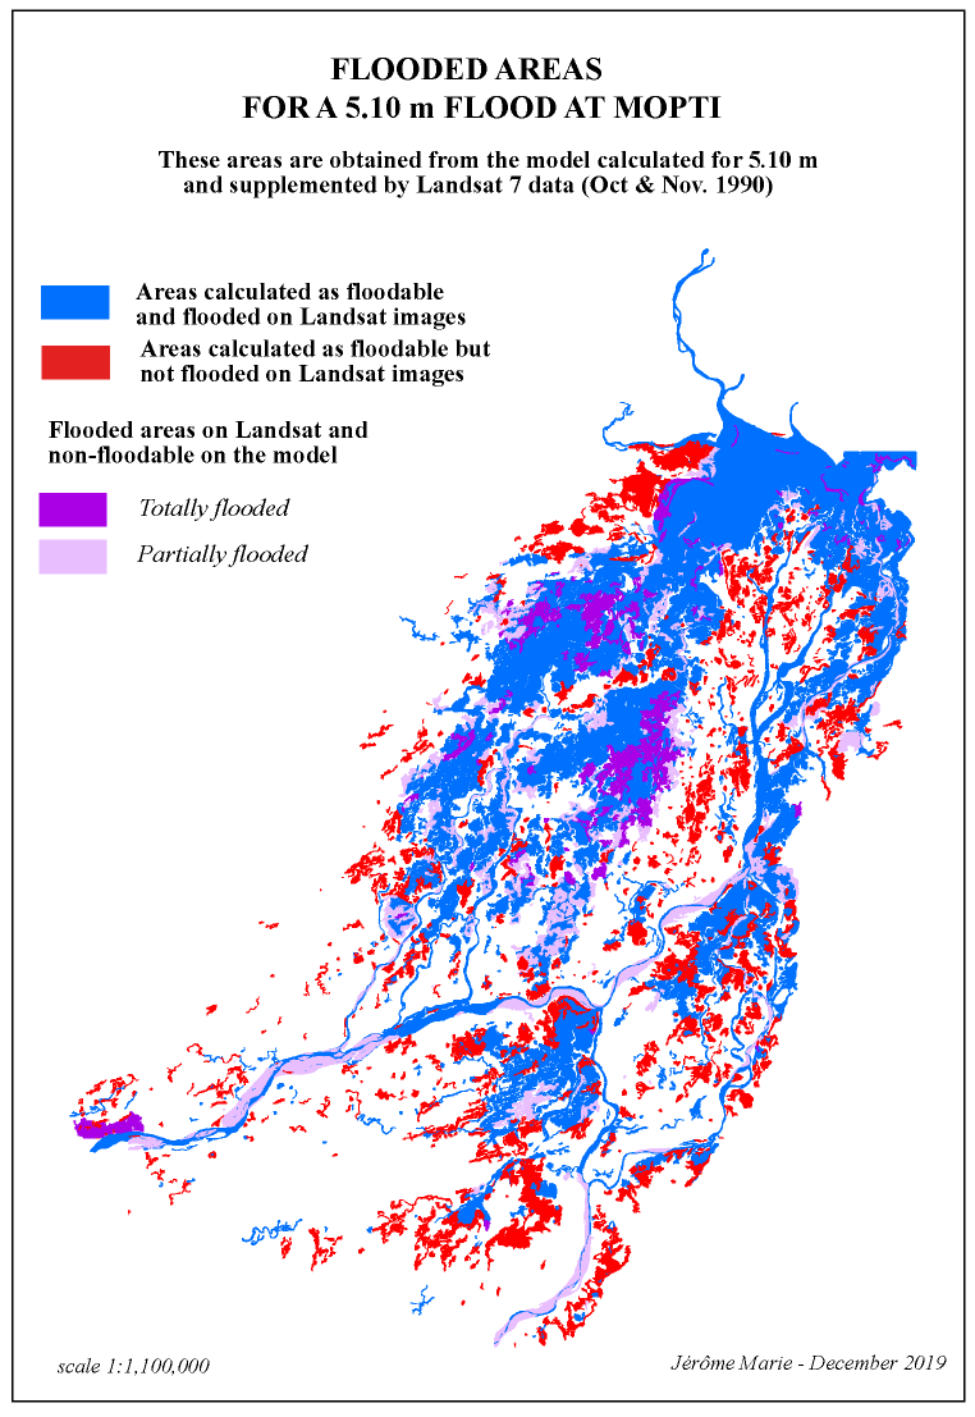
The
comparison
of
the
flooded
areas
calculated
by
the
model
with
flooded
areas
observed
in
the
Landsat
images
leads
to
the
following remarks:
1
-
The
flooded
and
heavily
vegetated
area
common
to
the
Landsat
images
and
the
flooded
area
calculated
by
the
model
extends
over
496,775
ha
.
Thus
the
ratio
of
common
area
/
flooded
area
of
the
model
reaches
74.7%
,
showing
that
confidence
in
the
model
calculations decreases with the lower floods.
2
-
The
summary
map
figures
(in
red)
areas
calculated
by
the
model
as
floodable
but
not
flooded
on
Landsat
extending
over
167,534
ha
;
and,
conversely,
areas
flooded
on
Landsat
which
are
not
flooded
according
to
the
model
figure
(in
purple
and
mauve)
:
they extend over
126,101
ha
3
-
The
effectively
non-flooded
areas
(in
red)
are
located
in
four
places:
on
the
right
bank
of
the
Niger
river
upstream
from
Mopti,
confirming
the
poor
flood
water
provision
of
this
region
of
the
Delta
with
the
flood
almost
disappearing
from
the
Pondori
basin;
the
south
of
the
Ténenkou
Basin;
the
surroundings
of
the
Peru
Dialloubé
and
the
northwest
of
the
Delta
in
connection
with
the
lower than expected flood at Akka at the exit of the Débo lake.
4 - The areas totally or partially flooded on Landsat and not flooded according to the model are mainly located:
•
In
the
MB2
vegetation
mosaic
units
along
the
Niger
and
Bani,
which
according
to
the
model
have
a
flood
depth
of
-1.40m,
and
are
therefore
not
flooded
at
5.10
m;
yet
in
reality,
they
are
composed
of
banks
at
the
0
m
level
and
a
series
of
levees
and
channels whose flood depth ranges as low as - 2.80 m;
•
In
and
around
the
Toggere
Coumbe,
Kakagnan
and
Kadial
basins,
highlighting
the
influence
of
the
peculiar
longitudinal
profile
of the Diaka defluent and the limits of its influence in relation to the Débo lake (see details on page 47).

510_1990.gdb contain two shape files
- Niv_510 :
The raw calculated model
-Synthèse_510_1990
with the following items:
sigle :
acronym of vegetal associations
niveau :
level of vegetal association
profond
:
submersion depth of vegetal associations
Val_rast : 0 = non flooded
1 = totally flooded
2 = partially flooded
Val_rast come from the analysis of Landsat Images
Synthèse : 1 = commun_510_1990
2 = inon_plus_1990
3= inon_moins_1990
510_1990(EN).rar


Area common to model and Landsat
Download