
Conclusion
The tests of the flooding model in isolines of equal depth call for a series of remarks:
•
The
first
comes
from
the
difficulty
to
get
a
good
series
of
Landsat
images
showing
the
successive
stages
of
the
flood
and
its
extent
over
the
entire
Delta.
If
we
are
lucky
to
have
had
images
since
1984
–
the
lowest
flood
in
the
century
–,
the
series
of
images
is,
however,
discontinuous
and
of
uneven
quality,
which
prevents
multiple
tests,
and
the
repeatability
of
these
images
is
not
sufficient
to
accurately
determine
the
maximum
flood
extension
for
each
year.
It
would
therefore
be
desirable
to
have
images
with
high
temporal resolution like MODIS in order to follow the progression of the flood across the Delta.
•
The
second
remark
is
liked
to
the
very
nature
of
the
floods:
we
tried
to
relate
each
height
of
our
flood-tests
to
a
"normal"
model
balancing
the
contributions
of
Niger
and
Bani
rivers
with
the
water
height
at
the
gauges
of
Mopti
and
Akka.
However,
all
the
floods
used
during
these
tests
were
found
to
be
specific,
sometimes
with
an
imbalance
between
the
contributions
from
the
Bani
and
Niger
rivers,
sometimes
because
of
an
abnormal
delay
in
the
dates
of
these
flood
contributions,
and
sometimes
for
both
reasons.
However,
we
have
learned
from
the
model:
it
works
satisfactorily
in
the
high
to
medium
flood
years,
with
a
confidence
ratio
that
is
always
above
83%
and
values
which
are
more
or
less
strongly
impacted
by
the
flow
imbalances
between
Niger
and
Bani.
The
confidence
ratio
decreases
when
the
maximum
flood
at
the
Mopti
gauge
decreases
from
6.00m
to
5.08
m
(75%)
and
again
to
4.40
m
(63%).
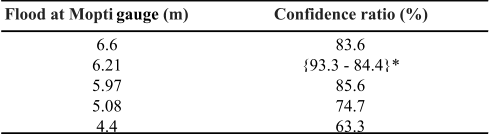
*
depending
on
whether
we
take
into
account
only
the
totally
flooded
surfaces
(84.4%)
or
all
of
the
surfaces
that
are
totally
or
partially
flooded
(93.3%).
If
we
assume
that
partially
flooded
surfaces
are
on
average
flooded
at
50
%,
the
confidence
ratio
stands
at 88.9%.
Beyond
the
confidence
that
we
may
have
in
the
model,
the
tests
reveal
a
certain
number
of
common
features:
weak
water
supply
in
the
south
of
the
Delta,
for
which
evidence
in
the
Pondori
basin
appears
when
the
flood
is
6.60
m
or
lower
at
the
Mopti
gauge,
and
is
confirmed
for
all
the
test
values.
This
shows
a
marked
imbalance
between
the
southern
part
of
the
Delta
(the
right
bank
of
Niger
up
to
Mopti
and
the
Bani)
and
the
left
bank
of
Niger,
which
is
much
better
supplied
by
flood
water,
in
particular
along
the
Diaka,
with
its
very
peculiar
topographic
profile.
This
"geo-morphological"
logic,
which
is
linked
to
inequalities
in
the
subsidence
of
the
Delta
basin,
is
confirmed
by
the
tests.
In
addition,
at
a
finer
scale,
there
is
a
local
logic
linked
to
the
propagation
of
the
flood:
a
deeply
flooded
vegetation
association
unit,
such
as
VB
or
B,
surrounded
by
less
deep
or
unflooded
associations,
will
be
poorly
flooded
or
not
flooded
at
all,
revealing
threshold
effects
common
at
the
edges
of
the
Delta
floodplain
or
in
the
Peru
of
Diallube.
On
the
contrary,
units
of
vegetation
associations
linked
to
shallow
flooding
when
they
are
lying
between
large
deeply-flooded
basins
will be more likely to be flooded and appear highly vegetated on Landsat images.
However
imperfect
it
may
be,
the
model
works
satisfactorily
for
flood
maxima
at
the
Mopti
gauge
between
6.00
m
and
6.60
m,
which
represent
73%
of
the
flood
years
between
1922
and
2014
(60
years
out
of
82
years
fully
surveyed).
The
model
begins
to
be
less
efficient
for
floods
between
6.00
m
and
5.10
m
at
the
Mopti
scale
(22%
of
flood
years),
and
to
markedly
deviate from observed floods for flood levels below 5.10 m (4 years out of 82 years, i.e. 5% of surveys).
Three questions arise, however:
1
-
Do
"normal"
floods
with
a
balanced
contribution
in
volume
and
in
the
propagation
times
of
the
Niger
and
Bani
rivers
exist
or
are they a calculation artefact?
2
-
The
model
works
in
a
"flat"
way:
a
bit
like
a
bathtub
that
is
filled
at
a
certain
level.
Is
it
possible
to
transform
it
into
a
digital
elevation model (D.E.M.) including the actual slopes and altitudes of the Delta? We will try to answer this question further down.
3
–
The
floods
of
the
Niger
and
Bani
Rivers
historically
range
at
the
Mopti
gauge
between
4.40
m
in
1984,
and
7.39
m
in
1924
(with
15
records
out
of
82
exceeding
7.00
m).
The
model
cannot
predict
flooding
beyond
6.60
m.
The
difference
between
the
strongest
flood
(7.39
m)
and
the
reference
flood
(6.60
m)
is
80
cm,
which
is
considerable.
Between
6.30
m
and
6.60
m,
the
potentially
floodable
areas
increase
by
8%
for
every
increase
of
10
cm
in
the
height
of
the
flood.
Compared
to
the
highest
flood
recorded,
the
increase
in
the
flooded
area
would
be
of
the
order
of
two
thirds
of
the
flooded
area
at
6.60
m,
i.e.
an
area
which
would
spread from 1,700,000 ha to almost 3,000,000 ha.
Towards
the
eastern
edge
of
the
Delta,
the
topography
very
strongly
limits
the
possibilities
of
extension
of
the
flooded
area.
Indeed,
at
the
edge
of
the
flood
plain,
there
is
a
glacis
with
a
slope
of
10
‰,
which
would
cause
a
very
slight
translation
of
the
limit
of
the
flood,
of
the
order
of
80
m
for
80
cm
of
flood
height.
The
situation
is
radically
different
on
the
western
edge
of
the
Delta,
where
the
floodplain
adjoins
the
"dead
Delta",
a
former
floodplain
of
the
Niger
river
before
it
moved
eastwards.
A
digital
elevation
model
of
decimetric
resolution
would
be
required
to
assess
the
area
and
pathways
that
the
flood
might
take
at
its
maximum
expansion.